From today, Eskom’s approved 9.4% increase in the electricity price comes into effect, and electricity users can expect to see an invoice with a higher amount owing to the utility company at the end of the month.
At the beginning of March, the National Energy Regulator of South Africa (Nersa) granted Eskom the right to increase the price of electricity by the aforementioned amount for the 2016/17 period – which was almost half of what the utility company originally wanted. Eskom applied to have a tariff hike so that it could recover R22.8 billion.
But what does it mean for the average home electricity user? We’ll give you a clue – it doesn’t mean you’ll be paying 9.4% more for your electricity. For tariffs are strange and complicated things, and the maths isn’t that simple.
Here’s how it all gets worked out and what it’s likely to mean for you.

There are two different pricing structures: non-local authority, and local authority. That simply determines if your home gets its power directly from Eskom, or a secondary party such as City Power.


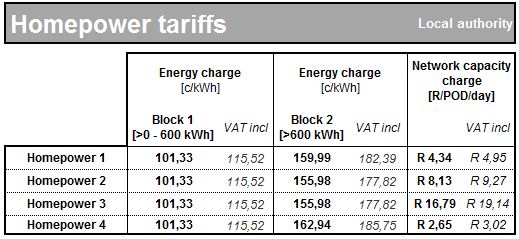
If you get your electricity directly from Eskom, you will pay R1.24 per kilowatt hour (kWh) if you use no more than 600 kilowatt hours, per month.
Then there’s the Network Capacity Charge, a standing charge applied to your account daily. This varies depending on the amount of electricity you use. If you use under 600 kWh a month, you fall into Block 1.
More, and you fall into Block 2, which are users that make use of more than 600 kilowatt hours, you are looking at paying R1.96 (for those on Homepower 1). For comparison to the pricing structure from the 2015/16 period (below), you will notice that the price on the Homepower scheme has been increased by 10.7 cents for users under 600 kilowatt hours.
If you fall into Homepower 1, your Network Capacity Charge has been increased by 46 cents per day.


To give it a bit more context on how the new pricing will affect you, a kilowatt hour is the use of one kilowatt of electricity in an hour. Cents per kilowatt hour, is the amount that you pay if you use a kilowatt in an hour.
So, let say a 100 watt lightbulb is left on for 10 hours, that would be one kilowatt per hour, equal to R1.24. For a 24-hour period, it would roughly work out to R3.10.
Now, if the bulb is left on for an entire month (which is 720 hours on a 30-day cycle), and using the R1.24 per kilowatt hour from above, the cost of that lightbulb is calculated by using the formula “wattage x hours used ÷ 1000 x price per kWh = cost of electricity”. So, in this case, the lightbulb running continuously for 720 hours will cost you R89.28 (incl VAT).
Under the previous payment structure, that running cost of the same lightbulb would have cost you R82 (an 8.8% increase, not 9.4%).
But again, it’s not that easy.
According to Eskom, the average household in South Africa uses between 500 and 750 kWh per month. Let’s assume that an average household uses 600 kWh per month, then: under the Homepower 1 tariff that equates to monthly bill of R747.54 for electricity, plus R160 for the daily charge. That brings the total to R907.54
Last year, the same usage would have cost R678 + R146.40 = R824.40. So with the increase, the average household will pay R83.14 more per month.
So in effect, our “average” householder is paying closer to 10% more year-on-year, not 9.4% at all.

Spread that across 12 months, you’d be paying almost R1 000 more just to keep the lights on.
For a guide as how much each of the major appliances use, the City of Cape Town created this handy graphic:

Eskom also has a rather nifty breakdown in an extensive .pdf on exactly how much most of the appliances use. That document can be found on its website.
[Image – CC by 2.0/radioedit]

